DP capability plot explained
What is a DP capability plot?
DP capability plot is a crucial tool developed to assess vessel ability to keep position and heading under certain environmental conditions.
Based on a vessel design we estimate external forces caused by wind, waves and current for every angle of attack. Important assumption is made that directions of this forces are coincident during analysis.
Again, based on a vessel design we estimate forces vessel is able to create with propulsion in each direction.
For fixed value of current we calculate limiting wind speed, when vessel is still able to maintain position.
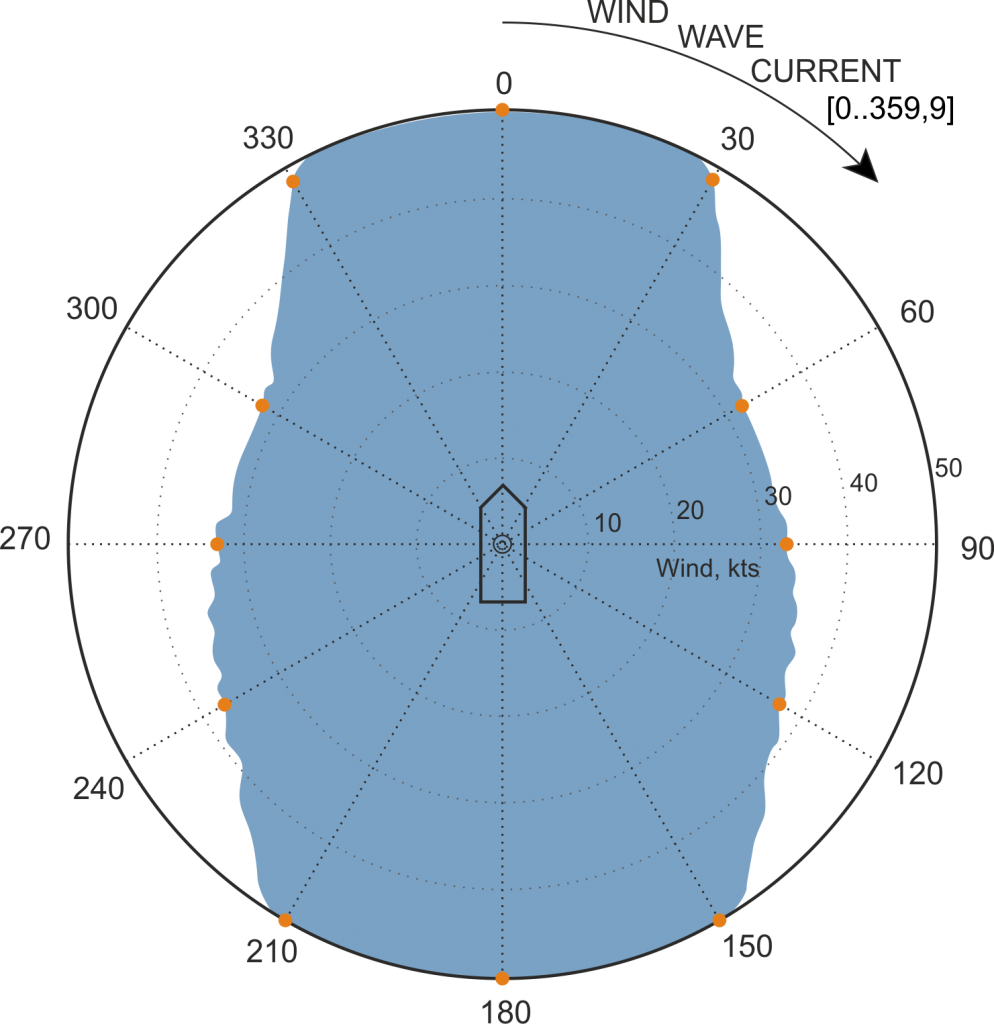
Results of the calculation are presented on a polar diagram below.
Centre of rotation of the vessel is at the centre of the plot.
Wind, wave and current are coming from angles stated on the external ring of the plot, rotating around the ship, where 0 degrees denote forces acting from the bow, and 180 degrees from the stern of the vessel.
Radial circles indicate wind speed, from 0 to 50 knots.
Shaded area shows limits of environmental conditions vessel is able to withstand.

Table below shows values of the wind at the edge of the shaded area (orange dots), reflecting maximum wind when vessel is still able to keep her position with fixed current of 2 knots (in this example).
| Direction of wind and current | 0 | 30 | 60 | 90 | 120 | 150 | 180 | 210 | 240 | 270 | 300 | 330 |
| Current, kts | 2 | 2 | 2 | 2 | 2 | 2 | 2 | 2 | 2 | 2 | 2 | 2 |
| Wind, kts | 50 | 49 | 31 | 33 | 37 | 50 | 50 | 50 | 37 | 33 | 31 | 49 |
For the simplicity wave force is not presented in this table. But you’ll find that in actual appendix to capability plots, where you can find data for all angles of attack, current values, magnitudes of all the forces and moments and utilisation of thrusters.
| Weather | Thruster data | ||||||||||
| Forces | Dir (deg) |
Mag
(kts, m, kts)
|
Surge X
Force (kN)
|
Sway Y
Force (kN)
|
Yaw Z
Moment
(kN*m)
|
Thrust.
number
|
Thr % |
Thr
(kN)
|
X Thrust
(kN)
|
Y Thrust
(kN)
|
Z Moment
(kN*m)
|
| Wind | 90 | 36 | - 0.0 | - 15.7 | 9.4 | Thr 1 | 100 | 4.2 | 0.0 | 4.2 | 28.6 |
| Wave | 90 | 5.1 | - 0.0 | - 1.8 | - 0.0 | Thr 2 | 100 | 4.2 | 0.0 | 4.2 | 25.2 |
| Current | 90 | 0.0 | - 0.0 | - 0.0 | - 0.0 | Thr 3 | 52 | 22.4 | 21.9 | 4.5 | - 35.5 |
| External | 0 | - 0.0 | - 0.0 | - 0.0 | Thr 4 | 100 | 22.4 | - 21.9 | 4.6 | - 29.9 | |
| Total | - 0.0 | - 17.6 | 9.4 | Total | 0.0 | 17.6 | - 9.4 | ||||
Examples of plots
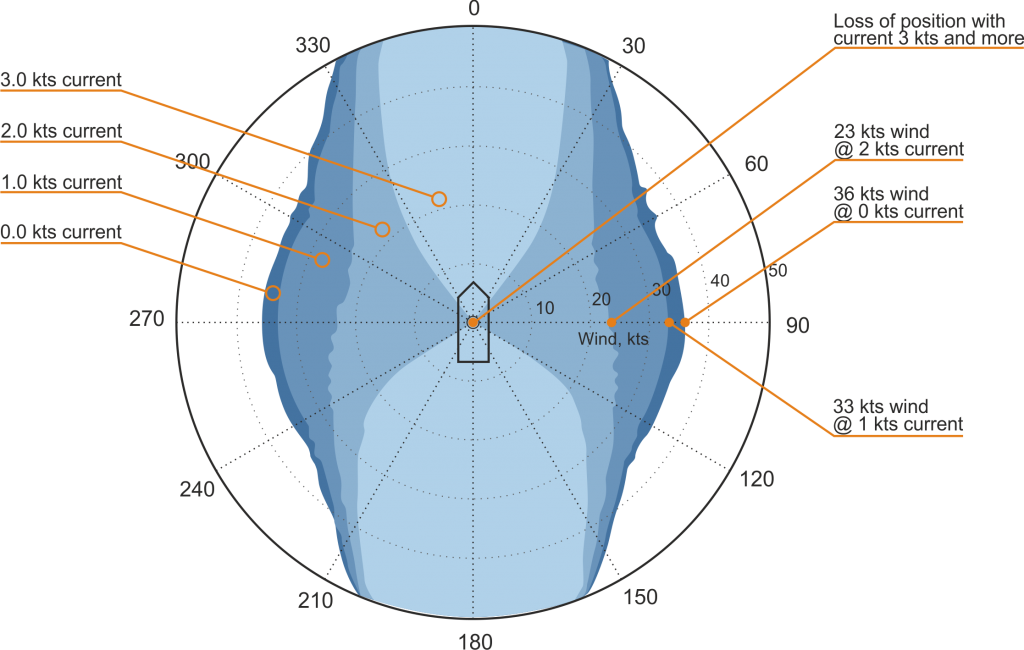
Another example below shows you the maximum wind speed vessel is able to withstand acting from 90 degrees for 0, 1, 2 and 3 knots current accordingly (see notes on the right side of the plot) for every value of the current (stated on the left side of the plot).
We usually show data for all values of the current on the same plot.

Same calculation is usually done for different kind of failures.
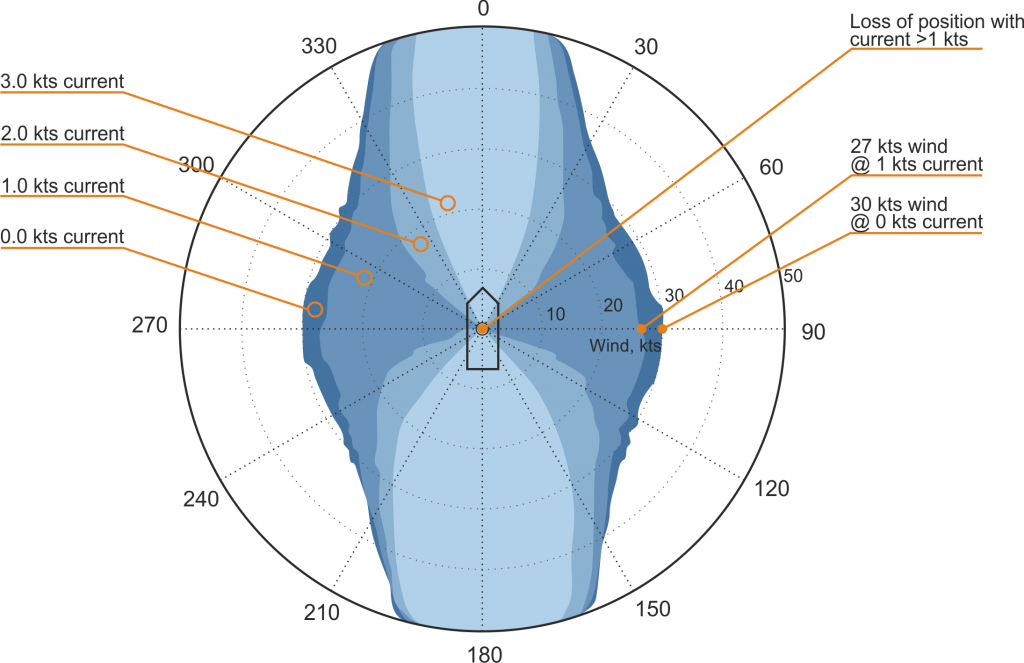
Here is the example of the plot for the same vessel but with loss of one of the bow thrusters:

You can easily see that limiting wind figures now are lower than in a first case for the same values of current.
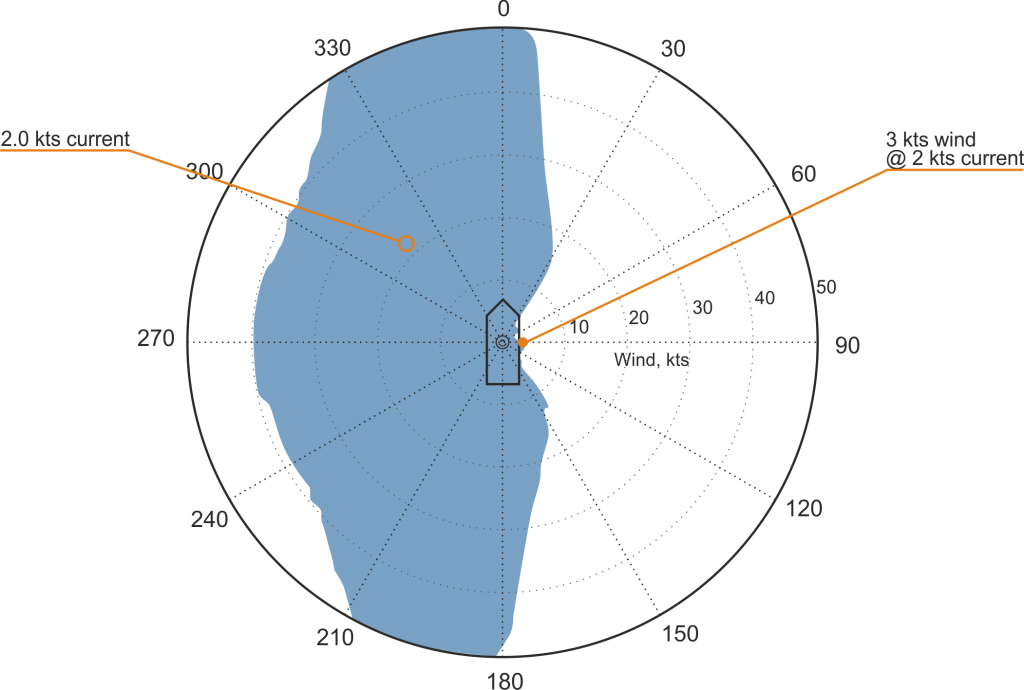
Next graph below, for the worst case failure, for example — lost of the bus feeding bow and stern thrusters.
We keep only one value of the current of 2 knots to easily distinct figure of the maximum wind of 3 knots only from starboard.

Interactive tool
Please use the interactive diagram below to understand that better.
Move mouse over the graph to see figures of wind and current for each angle. You can select or deselect specific values of the current by clicking on the legend.
Frequently asked questions
Can I assess position keeping accuracy using plots?No. The plot helps to understand weather limits for position keeping.
What are the formulas behind the plot?
Please refer to our full capability report. Contact us if you still have questions here.
Can I get required propulsion power from the plot?
It is possible. Based on a vessel design and required weather conditions we can calculate required power of propulsion back.
Does calculated environmental condition limits depend on DP (control) system?
Not really. Magnitude of external forces depends on wind and current speed and hull form, forces vessel is able to create to counteract them depends solely on propulsion power and design (type, location etc).
